Times Higher Education University Rankings
October 10, 2016Jocelyn Ong
In-class challenge: Using the data from the years 2011 to 2015, can we predict the scores for 2016?
Introduction
As promised, here’s a post about our first in-class group challenge that was held on Friday, October 7, 2016. We worked with the Times Higher Education University Rankings dataset.
We were given full data for the years 2011 to 2015; total scores were left out for 2016 and our goal was to predict total scores for 2016 based on a model that is trained with the data from 2011 to 2015.
We had about two hours to work on this data, and we were put into random groups of three. I worked with Michael and Max for this challenge.
About the dataset
All columns should have been numerical, but several of them showed up as objects/ strings when we first loaded the data, and the university names also showed up with random symbols.
The university names were converted easily enough by passing the encoding argument to the pandas.read_csv function. On further checking, most of the columns were forced into objects/ strings because zeros were represented with ‘-‘. With this information, we easily formatted most of the columns by passing the np_values argument to the pandas.read_csv function.
import pandas as pd
df = pd.read_csv('university-rankings.csv', encoding='latin1', na_values='-')
Here’s what our data looks like after loading it with the above code:
| Column name | Data type | Description |
|---|---|---|
| world_rank | String | world rank for the university - contains rank ranges and equal ranks (e.g. = 94 and 201-250) |
| university_name | String | name of university |
| country | String | country of each university |
| teaching | Float | university score for teaching (the learning environment) |
| international | Float | university score for international outlook (staff, students, research) |
| research | Float | university score for research (volume, income and reputation) |
| citations | Float | university score for citations (research influence) |
| income | Float | university score for industry income (knowledge transfer) |
| total_score | Float | total score for university, used to determine rank |
| num_students | String | number of students at the university |
| student_staff_ratio | Float | number of students divided by number of staff |
| international_students | String | percentage of students who are international |
| female_male_ratio | String | female student to male student ratio |
| year | Integer | year of the ranking |
* The descriptions were provided to us as part of the challenge
What we’re doing
We were tasked with building a model to predict the total score of a university. We could use any of the features we felt were applicable and our predicted scores for 2016 would be compared against the actual scores and the goal is to get the lowest mean squared error.
Data munging/ data wrangling
To be able to use the data in a linear regression model, we needed the columns to be either floats or integers.
The ‘num_students’ column was showing up as an object/string as a comma was used for the thousands separator, and the ‘international_students’ column was showing up as an object/ string due to the percent sign. We cleared that up with the following:
def rem_symbol(x):
    try:
        x = x.replace(',', '')
        return float(x)
    except:
        return np.nan
df['num_students'] = df['num_students'].map(rem_symbol)

df['percent_international_students'] = df['international_students'].map(lambda x: float(str(x).strip('%')))
The ‘female_male_ratio’ column needed a little more work. Some of the entries were already in the format of a float, some were expressed as FF:MM (where FF refers to the proportion of female students and MM the male students), and some as FF:MM:00. Once we figured out what the various formats were, we were able to craft a function to reformat the column:
def fm_ratio(x):
    if type(x) == float:
        return x
    try:
        return float(x)
    except:
        f, m = x.split(':')
        try:
            return float(f)/float(m)
        except:
            return float(f)

df['female_male_ratio'] = df['female_male_ratio'].map(fm_ratio)
We thought about including country as a feature so we looked into cleaning it up too. We noticed a couple of entries where United States of America and United Kingdom were misspelled so we replaced those. We then assigned a number to each country in the column.
Modeling: generating the model and drawing conclusions
Before generating a model, we created a heat map to check the correlations between each of the columns:
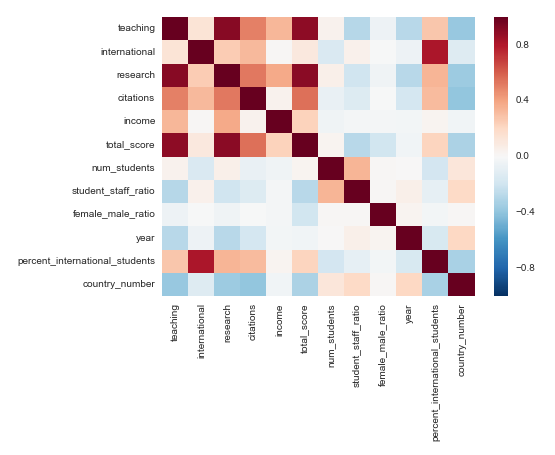
As we can see from the heatmap, total_score has the highest correlation with teaching, research, and citations. (Logically, total score should be a function of all the other scores, so the correlation isn’t surprising.)
We had been told to consider regularization and cross validation when building our model. Given that regularization would assign weights to coefficients to minimize them, we decided to run a ridge regression on all features and let the model decide which features were more important.
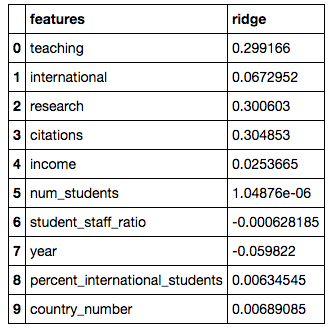
Based on our coefficients, we were able to tell which were the features which were important in our model. In this case, it was citations, with a positive coefficient (i.e. the higher the citations score, the higher the total score).
Our predictions were scored against the actual scores and we obtained a mean squared error of 0.012559 (yay!).
Round up
The mean squared error we got above was actually not from our first attempted submission. I believe we had a mean squared error of more than 700 (yikes!) for that first round.
The problem with our first submission was that we tried to predict scores for all universities, even those with ranks below 200.
Lesson learned: Always check and understand the data. If there wasn’t a target for training, was there a reason? Maybe those rows shouldn’t even be considered for the training data and predictions.
Until next time
I hope you enjoyed reading about our group lab on the Times Higher Education University Rankings. It was a fun challenge and we all learned a good lesson from it. We had a bit of trouble deciding how to work in a group - who’s going to do what, do we code separately etc. I haven’t concluded on the best way to work yet but I hope we’ll find something efficient in the weeks to come.
I’m looking forward to more group work in the future, it’s great hearing ideas from different perspectives. My next post will be about our third project from the Immersive, also our first group project! Stay tuned!
You can view my notebook for this project here.
Back to top ↑