How Much Do Data Scientists Get Paid
October 19, 2016Jocelyn Ong
What affects a data scientist’s pay scale?

Background
This week we’ll look at predicting a categorical dependent using logistic regression with data obtained by web scraping. This is Project 4 from the Data Science Immersive at General Assembly, and it’s also a group project. I’ll be working with Amer and Thomas on this project.
In this week’s scenario, we’re data scientists at a firm offering technology and scientific solutions, and our task is to find out what factors affect the pay scale of a data scientist so that our firm can be competitive in the hiring market. Instead of trying to link the various factors to a numeric pay, we will be looking at pay grades - whether a job is in the higher or lower range. To do this, we will be using logistic regression.
Executive Summary (or TL;DR)
Our objective is to use data from job search aggregators to determine what industry factors affect a data scientist’s pay scale. We looked at the location of the job and the job description, which may include education and experience requirements, and programming language and software knowledge requirements etc.
Rather than try to predict the actual salary based on the above, we looked at whether the salary is expected to be in the higher or lower range. We pulled our data from the aggregators via web scraping, then formatted the data into numerical data through dummy variables. Each job was then put into either the higher pay bin or the lower pay bin. With this, we trained a logistic regression model which we could then use to predict pay grades for other job listings where salaries were not disclosed. (A logistic regression model is used for classification problems.)
Based on our model, we found that the following features were important:
- Location
- Sector
A more detailed and technical write-up follows below.
Objectives
Breaking it down, our tasks are:
- Obtain data from aggregators via web scraping
- Format data so that we can use them as features in our logistic regression model
- Set a threshold to determine what defines a higher or lower range pay grade
- Build a logistic regression model with pay grade as our target, and the various factors as our features
- Based on the model performance, determine which factors had a bigger impact and how those factors determined whether a job is in the higher or lower range
Obtaining the data
Where and how
Our data was obtained from Glassdoor using the python libraries selenium and BeautifulSoup.
Amer created a python script which pulls data from the Glassdoor salaries page, and includes the job title, company and salary. You can view/ download his code here on Github.
In essence, we used selenium to get the source code, determined the HTML tags and class attributes of each item that we needed, then wrote the relevant functions so that we could iterate through several pages for each search.
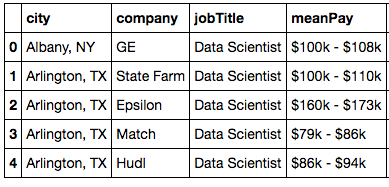
Here’s what we managed to scrape:
In addition to the Glassdoor data, we thought about what were some of the factors that could affect a data scientist’s pay scale, and came up with market capitalization, sector, and cost of living. Thomas pulled and cleaned this data and merged it with out Glassdoor data. Market capitalization was treated as a categorical variable (i.e. grouped into bins) rather than a continuous variable.
Data munging/ data wrangling
Having scraped what information we could, we then worked on cleaning this data.
Salaries were usually expressed as $XXX,XXX and the $ and , prevent us from converting these to floats. Also, salaries usually come in a range, and it would be easier to work with a single number. So we removed all the $ and ,, found the mean of the salary range, and used that as our estimated salary. This was then grouped into two bins for the purposes of our classification model.
Location is usually expressed as City, State, so we split those up into separate columns.
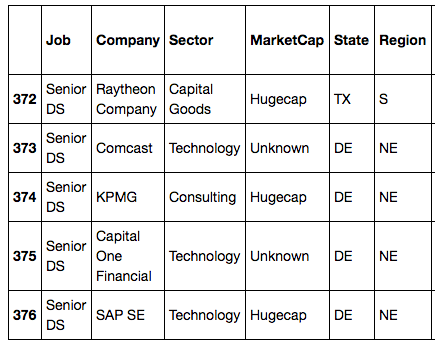
Here’s what our clean data looks like:
Since the data that goes into a LogisticRegression model needs to be numerical, we created dummy variables for each of our features:
- Job title
- Market capitalization
- Sector
- State
- Region
Data dictionary
* Note: This refers to columns before we generated our dummy variables.
| Column | Type | Description |
|---|---|---|
| Job title | String | Title of the position |
| State | String | 2 letter representation of the US State |
| City | String | City where the job is located |
| Salary | String | Salary bin where the job falls under (high, medium, low) |
| Market capitalization | String | How big the company’s market capitalization is |
| Sector | String | Sector which the company operates in |
| Living standards (several columns) | Float | The index of the cost of living based on several categories/ criteria |
Modeling: generating the model and drawing conclusions
Using GridSearch and LogisticRegression, we built our model using the five features listed above.
gs = GridSearchCV(LogisticRegression(),
                  {'penalty': penalties,
                   'C': np.linspace(1,1001,10)},
                  cv=3)
gs.fit(X,y)
We ran it a few times pulling out a different feature each time to see how it would affect the score of the model.
We found that the biggest changes in scores came from Sector, State and Region. Job title did not matter much contrary to our initial belief.
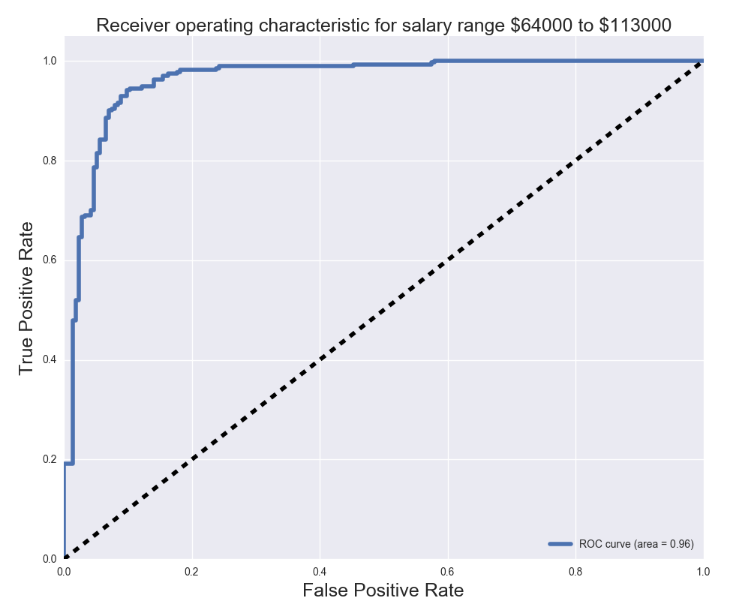
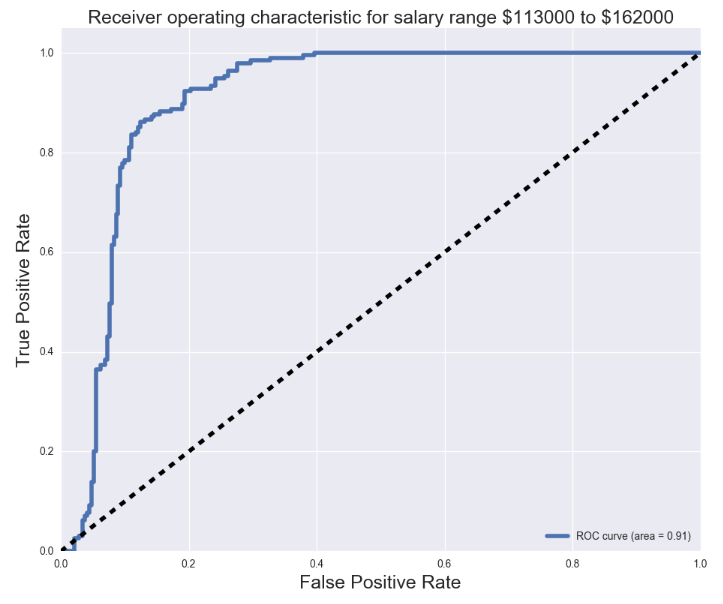
Using our model, we created our confusion matrix, and found our precision, recall, and F1 scores. We obtained an F1 score slightly above 0.7 for our model. We also plotted the receiver operating characteristic (ROC) curves and found the area under curve for each one.

Fun stuff
Word Cloud!
Yes, yes, word clouds may be passé, and some people consider them dreadful or hideous, but I found them interesting and pretty as a background image. (Maybe not that informative though, because I’ve never really looked at the words of any word cloud in detail.)
Apart from Glassdoor, I also scraped data from Indeed.com, and I thought it might be fun to just generate a word cloud for presentation purposes. I had no idea where to start or how to start, but luckily, someone had already created a python library! You can view the documentation and download the library here on GitHub.
Using the library was simple and the instructions on GitHub were easy to follow.
from wordcloud import WordCloud, get_single_color_func

wordcloud = WordCloud(max_font_size=50, relative_scaling=0.3, background_color='white',   color_func=get_single_color_func('blue')).generate(' '.join(text))

plt.figure(figsize=(16,8))
plt.imshow(wordcloud)
plt.axis("off")
plt.show()
Here’s what we got from the above code (also seen at the top of this post):
Round up
We didn’t approach this project in the manner suggested (getting data from Indeed.com, and the bonus of using text features), but I think we’ve got a pretty good result from what we had. By the way, there was an interesting article this morning on Glassdoor using machine learning to predict salaries!
Glassdoor is using a proprietary machine learning algorithm to calculate an individual’s “market value” – the median base pay he or she could potentially earn in their local job market.
Sounds like what we just went through!
Next steps
I’d like to look at text as predictors, for example, do different skill requirements (e.g. scripting language used) affect the pay scale?
This would entail pulling job descriptions, identifying important words, and checking for the occurrence of those words in the job descriptions.
Until next time
Thank you for reading and I hope you’ve enjoyed reading about what we did this week! I wish I could have gone into more detail on the web scraping, but we can do that in a future post. It’s a interesting tool that can get frustrating when you’re staring at the HTML and wondering where your information is kept, but when you do get it out, you’ll be amazed at what you can get from the web.
You can view my notebook for this project here, and take a look at our presentation on Prezi!
Back to top ↑