Predicting Imdb Ratings
November 01, 2016Jocelyn Ong
What affects the rating of a movie on IMDb?
Introduction
This week we’re working with movie data! We’ll be getting information from IMDb with some help from the OMDb API.
IMDb is now the world’s most popular and authoritative source for movie, TV and celebrity content. We offer a searchable database of more than 185 million data items including more than 3.5 million movies, TV and entertainment programs and 7 million cast and crew members. (source: IMDb)
We’ll be looking at IMDb ratings and what are some of the things that affect a movie’s ratings. Brainstorming before we actually obtain the data, some possible factors may be:
- Who stars in the movie
- Who directed the movie
- Length of the movie
- What genre(s) is the movie
TL;DR
We got web-scraped data from IMDb with some help from OMDb API, transformed some of the words into features, and tried to predict actual ratings (failed) and/ or predict whether ratings will be higher than 8.5 (didn’t do too badly). We found that the director of a movie has a pretty big impact on whether ratings will be higher than 8.5 on IMDb.
About the data
How we obtained our data
Hello, BeautifulSoup! No, I didn’t use much of it this time around. (I tried, but everything took too long to run. Maybe I’ll try it again when I have more time.)
We had a lot of guidance for obtaining the data this week in our labs. Each movie’s page on IMDb can be accessed by a unique IMDB ID that starts with “tt” followed by 9 numbers. Using a combination of the requests and re libraries, we pulled the movie IDs of the top 250 rated movies.
r2 = requests.get("http://www.imdb.com/chart/top")
id_list = re.findall("tt[0-9]{7,8}", r2.content)

# set removes duplicates
# change it back to a list so we can iterate through it later
id_list = list(set(id_list))
Now that we have our IDs, we used the OMDb API to pull some basic data of each movie.
# OMDb API URL
api_url = "http://www.omdbapi.com/?i={}&plot=full&r=json"
# Create a function to get the data for each movie
# into a format we can work with
def get_content(id_num):
    r = requests.get(api_url.format(id_num))
    tmp = json.loads(r.text)
    return tmp
# Populate our data
df = pd.DataFrame([get_content(i) for i in id_list])
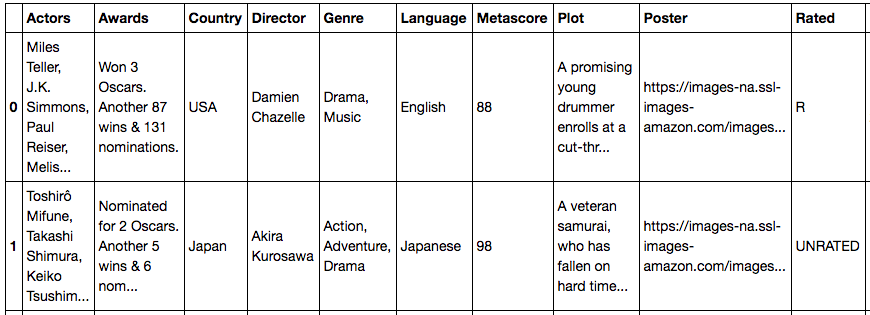
Here’s the data we pulled using the API.
We were then asked to pull data on gross earnings of each movie as well. (Here’s where I used BeautifulSoup.)
# Create a function to pull Gross Earnings information
# and return np.nan if it's not available
def get_gross(id_num):
    r = requests.get("http://www.imdb.com/title/{}/".format(id_num))
    soup = bs4.BeautifulSoup(r.text, "lxml")
    try:
        for i in soup.findAll("div", class_="txt-block"):
            for j in i.findAll("h4", class_="inline"):
                if "Gross" in j.text:
                    text = j.parent.text.split()[1]
                    num = text.replace(",", "").strip("$")
                    return float(num)
    except:
        return np.nan
# Create a column in the dataframe for Gross Earnings
df["Gross_earnings"] = df["imdbID"].map(get_gross)
Description of the data (data dictionary)
| Column | Data type | Description |
|---|---|---|
| Actors | String | List of top-billed actors |
| Awards | String | List of awards won or nominations |
| Country | String | Countries where the movie was shown |
| Director | String | Director(s) of the movie |
| Genre | String | Genre(s) of the movie |
| Language | String | Language(s) the movie is available in |
| Metascore | String | Score from metacritic.com |
| Plot | String | Summary of the movie |
| Poster | String | URL for the movie poster |
| Rated | String | Viewer advisory rating for the movie |
| Released | String | Release date for the movie |
| Runtime | String | Length of the movie in minutes |
| Title | String | Movie title |
| Writer | String | Writers for the movie |
| Year | String | Year in which the movie was released |
| imdbID | String | IMDb ID of the movie |
| imdbRating | String | IMDb rating of the movie |
| imdbVotes | String | Number of votes received |
| Gross_earnings | Float | Gross earnings of the movie |
Data munging/ data wrangling
As you can see, most of our columns are strings, which is not something we can use in our models (not that I’m aware of at least), so we’ll have to clean and work on our data so that everything is numerical.
Columns like Year, imdbRating etc. should have been either integers or floats, and we converted them using df["col_name"] = df["col_name"].astype(float).
We also want to convert some of the text columns to dummies so that we can use them in our model.
- Oscars won
def oscars_won(i): try: i_list = i.split() i_list = [x.strip(".") for x in i_list] if "Oscars" in i_list and i_list[i_list.index("Oscars")-2] == "Won": return float(i_list[i_list.index("Oscars")-1]) elif "Oscar" in i_list and i_list[i_list.index("Oscar")-2] == "Won": return float(i_list[i_list.index("Oscar")-1]) else: return 0 except: return 0 - Languages, countries, actors, directors
# Let"s consider the language the movie is available in
# For model simplicity, we'll consider just the top 5 languages
all_languages = []
for i in df2["Language"]:
  lang_list = str(i).split(",")
  all_languages.extend([j.strip() for j in lang_list])
top_10_languages = [i[0] for i in Counter(all_languages).most_common(10)]
for i in top_10_languages:
  df2["Language_"+i] = df2["Language"].map(lambda x: 1 if i in str(x) else 0)
Using TfidfVectorizer, we also generated word features from our plot summaries.
tfidf = feature_extraction.text.TfidfVectorizer(stop_words="english", ngram_range=(1,1), max_features=1000)
plot_df = pd.DataFrame(tfidf.fit_transform(df6["Plot"]).todense(), columns=tfidf.get_feature_names())
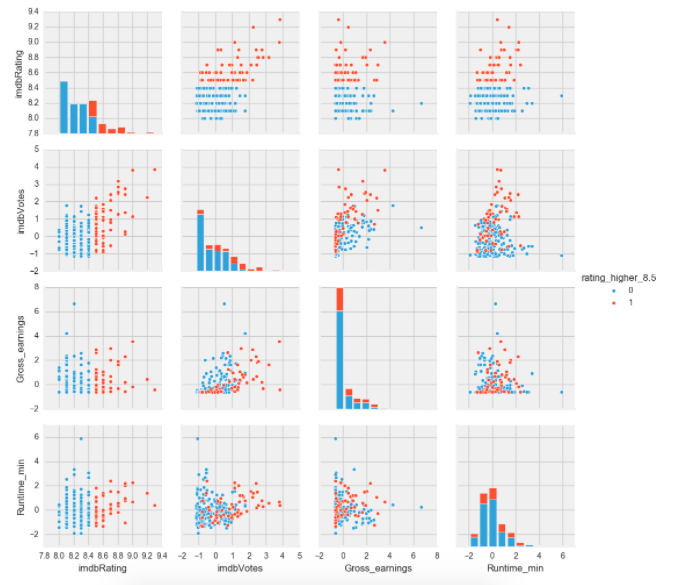
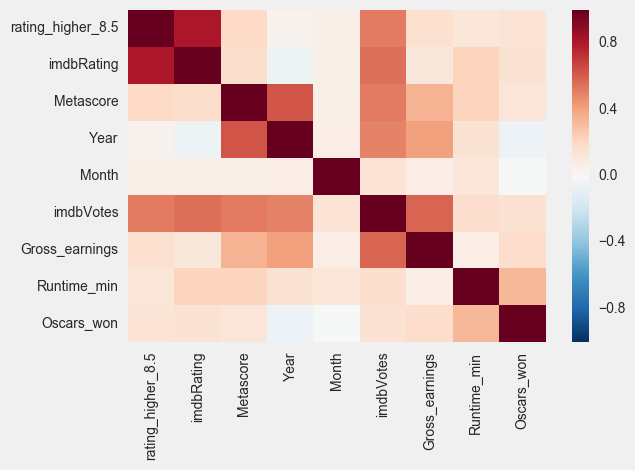
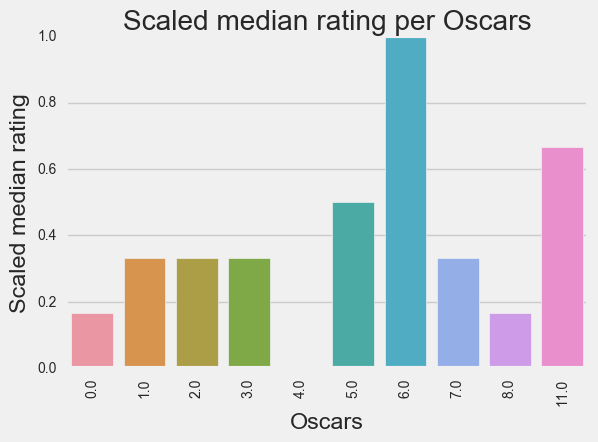
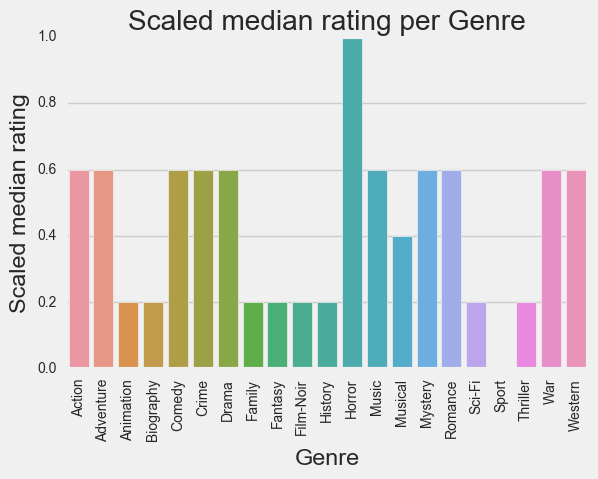
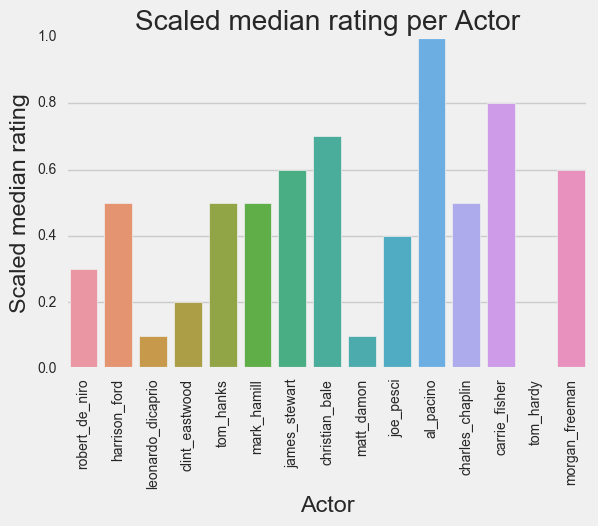
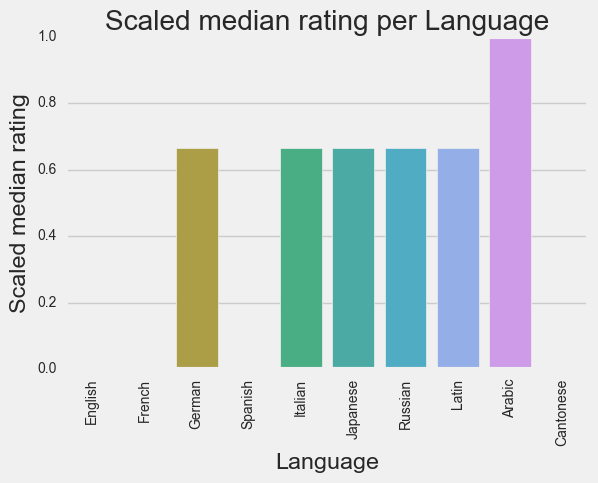
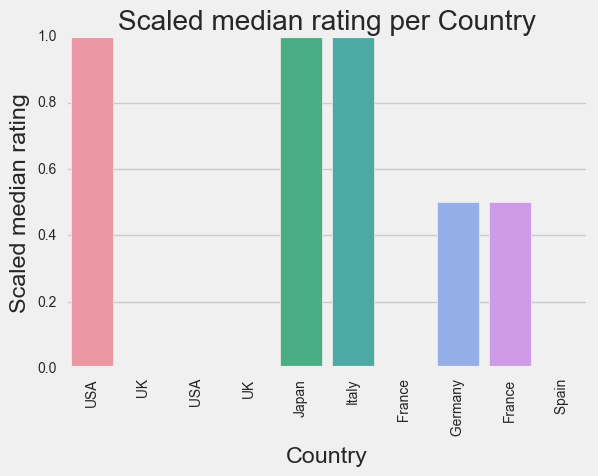
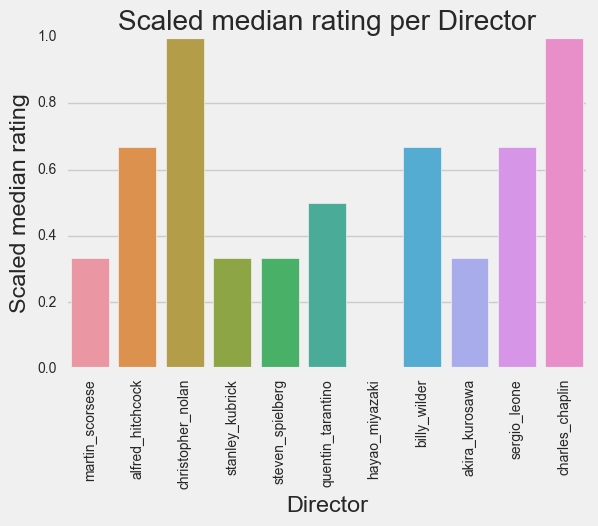
Visualizations
Before we get to modeling, we’ll take a look at the relationships within out data.
Modeling: generating the model and drawing conclusions
So I tried both regression (predicting actual ratings) and classification (predicting whether a movie will have a rating higher than 8.5) with this dataset. I wanted to test several models, so I created a function to evaluate them:
def fit_model(model, name,  X_train, X_test, y_train, y_test, mtype="r"):
    model.fit(X_train,y_train)
    y_pred = model.predict(X_test)
    score = model.score(X_test, y_test)
    print "{} Score: {:.2f}".format(name, score)

    if mtype=="r":
        print "{} MSE: {:.2f}".format(name, metrics.mean_squared_error(y_test, y_pred))

    return model, y_pred
def evaluate_model(model, name, mtype="r", X=df4.iloc[:, 8:]):
    print name
    if mtype=="r":
        # set X and y
        y = df4["imdbRating"]
        X_train, X_test, y_train, y_test = model_selection.train_test_split(X, y, test_size=0.3, random_state=77)

        # fit the model
        model, y_pred = fit_model(model, name, X_train, X_test, y_train, y_test, mtype)

        # Plotting
        plt.plot([min(y_test), max(y_test)],[min(y_test), max(y_test)],'-');
        plt.scatter(y_pred, y_test);
        plt.title("{}\nActual and predicted ratings".format(name));
        plt.xlabel("Predicted");
        plt.ylabel("Actual");
        plt.show();
        return model

    elif mtype=="c":
        # set X and y
        y_class = df4["rating_higher_8.5"]
        X_train, X_test, y_train, y_test = model_selection.train_test_split(X, y_class, stratify=y_class,
                                                                      test_size=0.3, random_state=77)

        # fit the model
        model, y_pred = fit_model(model, name, X_train, X_test, y_train, y_test, mtype)

        # confusion matrix
        conmat = metrics.confusion_matrix(y_test, y_pred)
        conmat = pd.DataFrame(conmat)
        conmat

        # classification report
        print metrics.classification_report(y_test, y_pred)

        # plotting
        try:
            y_score = model.decision_function(X_test)
        except:
            y_score = model.predict_proba(X_test)[:,1]

        fpr, tpr, thresholds = metrics.roc_curve(y_test, y_score)
        plt.plot(fpr,tpr);
        plt.title("{}\nROC curve".format(name));
        plt.ylim((-0.1, 1.1));
        plt.xlim((-0.1, 1.1));
        plt.xlabel("FPR");
        plt.ylabel("TPR");
        plt.text(0.8,0.05,"AUC: {:0.2f}".format(metrics.roc_auc_score(y_test, y_score)));

        return model, conmat, X, y
    else:
        return "Wrong type"
Here’s a couple of our plots from the above:
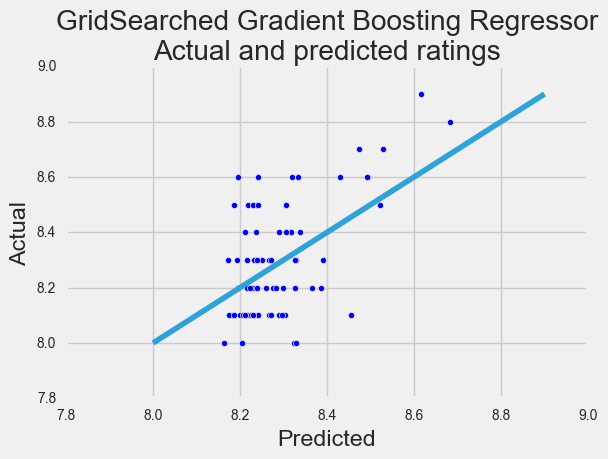
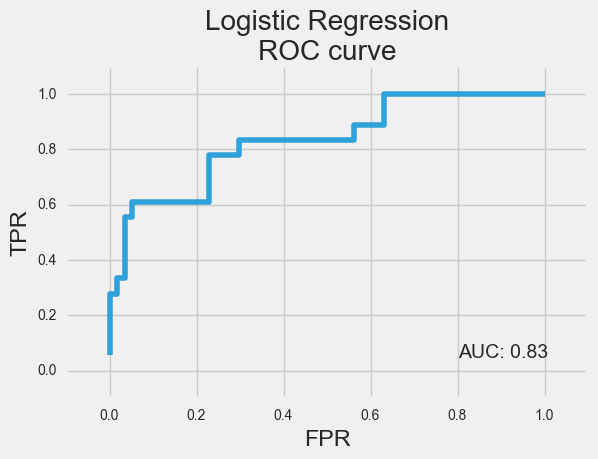
With each model we ran our score functions, and regression was terrible. Classification did quite well with an average accuracy of about 80%.
We also looked at the coefficients of our classification model:
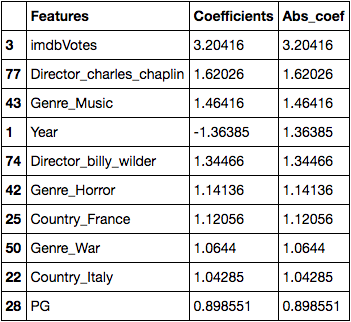
One of the things that I noted (before looking at the coefficients) was that:
- Actors don’t matter
- Plot summary doesn’t matter
- DIRECTORS MATTER!
I happened to run my models a few times (without text features, with actors and plot summary, and with directors) and the only improvement in scores came when directors were added in.
Next Steps
I wish we could have trained our model on a bigger and more varied training set. (Recall: we only worked on the all-time 250 movies on IMDB for this project.) I did try to get more information - I managed to get more movied IDs but it took too long to pull some of the other information. Maybe I’ll try it out when I get a more powerful machine.
Until Next Time
I hope you enjoyed reading about movies (I’d rather just watch them), and I do hope I’ll have time to work on those next steps! Meanwhile, take a look at the detailed code for this project here.
Back to top ↑