Predicting Loan Approvals
May 08, 2017Jocelyn Ong
Predicting whether a loan application to Lending Club will be approved
Introduction
In this post, we’ll be looking at data obtained from Lending Club. Lending Club is an online credit marketplace, and it facilitates peer-to-peer loans and financing options. The loans are still considered issued by a bank and are subject to the same consumer protection, fair lending, and disclosure requirements as any other bank loan.
TL;DR
We look at common details between loans rejected and loans approved to see if we can figure out what are the factors affecting loan approval and whether we can predict if a future loan would be approved.
Based on our regression analysis, we find that the purpose of the loan and the employment length of the applicant have the greatest effect on whether a loan is approved. The loan amount actually has the smallest impact. So it doesn’t mean that just because you’re borrowing a small amount, you’re more likely to have your loan approved.
We also performed a regression analysis with purpose dummy variables, and found that stating “Car” can be quite detrimental to your loan approval.
About the data
There are 2 different data sets available from Lending Club. For approved loans, the data set contains a lot more data, including repayment and loan default details. For rejected loans, we have information on the purpose of the loan, the state and zip code, and the applicant’s debt to income ratio etc.
For each data set, Lending Club also separated them by dates, so our first step was to combine all the different dates into one big data set.
Classes
Our classes fall under the column “policy code”. There are 3 different classes.
- 0: rejected
- 1: approved
- 2: rejected because there were no suitable products available
Technically, if we wanted to see whether a loan application would be approved or rejected, we could combine 0 and 2. I left them as they were to see how our regression analysis would be affected.
Features
For the current stage of the project, we will only consider whether loan applications are approved or rejected. I do believe we have enough data to look into predicting loan defaults later on, but that’s for another time.
After looking through the columns on each dataset, we matched the most likely/ most useful column from the approved loans to the rejected loans, then combined the 2 into a data set on loan applications.
Our features are:
- loan amount
- debt to income ratio
- employment length
- zip code and state
- there should be some collinearity here but removing zip code did not show any major change in the importance of state as a feature
- purpose
Modeling
In my first round of modeling, I used numbers to represent our categorical features. This was just so I could easily take a look at the coefficients later on to determine which of the features were important to our model.
We used a logistic regression model with 3-fold cross validation - which took a little while to run because we had quite a number of instances. Looking at our coefficients:
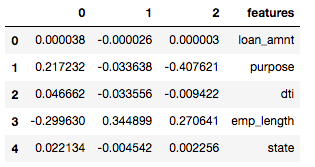
Each of the classes has their own regression coefficients and they tell us which features are important to determining whether or not an instance belongs to a certain class and how each feature affects the likelihood that it belongs to a certain class.
For example, if we look at class 0 (rejection of loan application), we see that purpose has a coefficient of 0.22 and employment length has a coefficient of -0.29. What do these numbers mean? As purpose increases by 1, there is an additional 0.22 chance that the instance will be of class 0 than of another class. (Although of course increase purpose by 1 doesn’t make any sense because each number represents a category.) Looking employment length makes more sense, because we encoded the number of years of employment to a corresponding number. So a coefficient of -0.29 means that when the number of years of employment increases by 1, the instance has 0.29 less chance of being classified as class 0 (i.e. it is less likely to be rejected).
Dummy variables
So the coefficients for purpose don’t make any sense now. To make sense of it, we created a model using dummy variables.
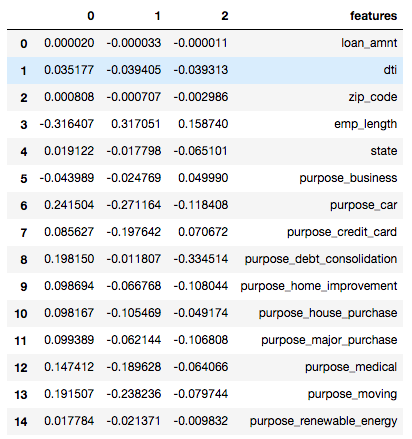
With dummies, the coefficients are how the chances of being classified as a certain class change between each dummy variable. For example, if the purpose of the loan was for business, there is 0.04 less chance of getting the loan rejected than if the purpose of the loan was other (base case).
Round up
Based on our models, we can see that Lending Club is more likely to approve a loan when employment lengths are greater. We can also look at how different purposes affect the likelihood of getting a loan rejected.
Thank you for reading this post! You can view my notebook here. (I wasn’t able to upload all the data though, because the file sizes are too big.)
Back to top ↑